
Osler ”Pete” Peterson
Medfield Select Board member
I started this blog to share the interesting and useful information that I saw while doing my job as a Medfield select board member. I thought that my fellow Medfield residents would also find that information interesting and useful as well. This blog is my effort to assist in creating a system to push the information out from the Town House to residents. Let me know if you have any thoughts on how it can be done better.
For information on my other job as an attorney (personal injury, civil litigation, estate planning and administration, and real estate), please feel free to contact me at 617-969-1500 or Osler.Peterson@OslerPeterson.com.
Recent Comments
Zach on Warrant Committee’s slid… Donna Knott on Reading for “Read Across… Lester Cohen on Town’s Buildings Require… Select Board member… on Black Out at Budget Works… Lester Cohen on Black Out at Budget Works…
Category Archives: Financial
Municipal Facilities Evaluation and Capital Plan
Comments Off on Municipal Facilities Evaluation and Capital Plan
Posted in Buildings, Financial, Planning, Uncategorized
Municipal Facilities Evaluation and Capital Plan
Comments Off on Municipal Facilities Evaluation and Capital Plan
Posted in Budgets, Buildings, Financial, Planning, Uncategorized
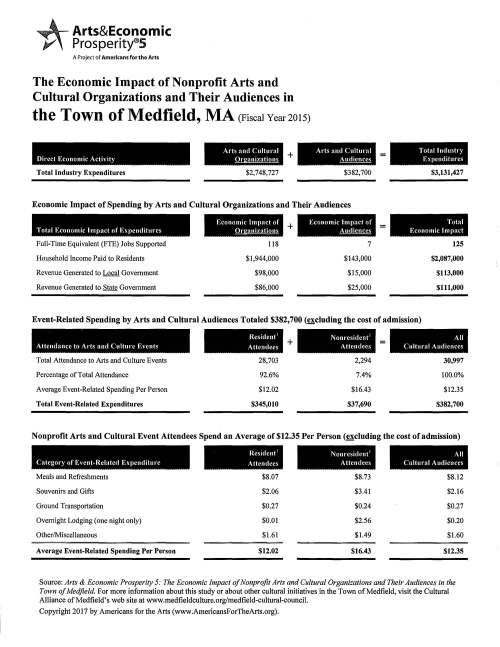
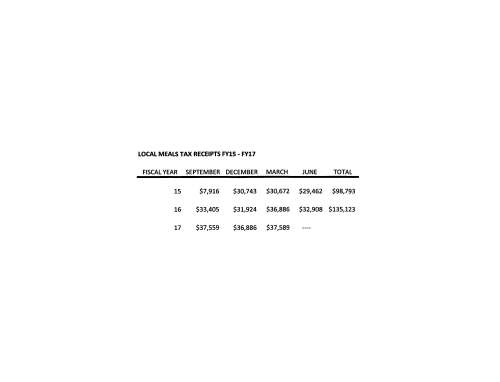
Meals tax revenue

Medfield netted $135,123 for FY 16 (the last year for which we have the complete yearly figures) from our meals tax, which our annual town meeting (ATM) enacted a few years ago. I think of the meals tax as the town’s chance to tax the residents of our surrounding towns for enjoying our excellent restaurants. At the Tuesday meeting of the Board of Selectmen Mike Sullivan shared his historic record of our net since the ATM adopted the meals tax. I especially like the trajectory and the rate of growth. I also especially like seeing documentation that our restaurants are doing increasingly much more business year over year.
More on chip seal
I asked Maurice Goulet, the Director of the DPW, a follow up question about chip seal and got more really useful information back from him this morning (a copy of that email appears below – I also inserted Moe’s original information at the end). The “capital” he references is the town’s annual capital budget, which typically allocates monies to resurface subdivision roads.

On Sat, Jul 8, 2017 at 11:26 AM, Osler L. Peterson <osler.peterson@verizon.net> wrote:
Moe,
I am sorry to be late in responding to your materials, but yes, that is hugely helpful, and exactly the quantification of the cost differential that assists me to understand the magnitude of savings. I just had time to post your data on my blog, and I am betting that the residents will be equally as appreciative as I am at your putting that material together for us.
So a big thank you from me for doing that and for doing it so well and so clearly.
I guess I do have one follow up chip seal question as I think about it today, namely how many miles of chip seal do we typically do per year? Even if the savings percentage is really high, if the actual total spending amount is not too great per year, we might still opt to asphalt – e.g. I bet the town residents might opt for pavement over chip seal if it only cost us $100K more per year. Thanks in advance.
Best,
Pete
Osler L. Peterson, Esq.
===========================================================
Pete,
It would be difficult to give you an estimate in roadway miles as our roadways differ so much in width, however speaking with Bobby Kennedy we average about $150,000 – $200,000 per year on chip seal.
With the calculations I had sent you, it would cost approximately $425,000 – $575,000 for overlay (does not include costs of adjusting castings and repairing driveway aprons) and $555,000 – $750,000 for mill and overlay if we were to resurface the same amount of roadways. This would drastically reduce the number of roadways we could maintain per year. Once our pavement management system is in place, we will have a better understanding of the town’s needs. Even with the pavement management system, it may not consider to utilize chip seal as much, reducing the number of roadways that are resurfaced. (Chapter 90 state funding allotment for Medfield is $395,076 per year plus usually $30,000 – $40,000 from capital) The roadways that are not resurfaced puts added pressure on the Highway Division for maintenance throughout the year.
Thanks,
===========================================================
From: Maurice Goulet [mailto:mgoulet@medfield.net]
Sent: Friday, July 7, 2017 8:30 AM
To: Osler L. Peterson <osler.peterson@verizon.net>
Cc: Mike Sullivan <msullivan@medfield.net>
Subject: Chip Seal and Overlay Comparison
Pete,
Below is a comparison of Chip Sealing roadways vs. Pavement Overlay and/or Mill and Overlay as requested.
Consider a scenario of 1 mile of roadway that is 20 feet wide at current contractor prices:
5,280 feet long X 20 feet wide / 9 = 11,733 square yards
$24,639 – chip seal
$69,922 – pavement overlay
(65% savings)
(pavement overlay does not include raising structures such as catch basins, manholes and gates, and reconstructing driveway aprons affected by raising pavement elevation, pavement elevation changes also creates new drainage issues)
Overlaying on a distressed roadway develops reflective cracking through the new surface within a few years affecting longevity of the surface. Milling (grinding) and overlay would then be considered as the preferred method.
$24,639 – chip seal
$91,628 – mill and overlay
(73% savings)
Please let me know if you have any questions. Hope this is helpful.
—
Maurice G. Goulet
Director of Public Works
Medfield, Massachusetts
Medfield Garden Club requests town’s financial support

Medfield Garden Club Request for Funding for TASC (Town Area Sites)
The Medfield Garden Club is requesting $2500 from the Town of Medfield’s Local Meal Tax Fund to defray the cost of renovation for several of its civic planting sites and to contribute to the ongoing maintenance of the club’s twenty-three sites in town.
The Medfield Garden Club was established in 1933 for the purpose of community beautification, conservation, and education. The first civic plantings by the club were done in 1935 when Medfield Garden Club members planted trees at schools and the police station. The club has a long history of volunteerism in town. The Medfield Garden Club currently maintains twenty-three TASC sites around Medfield with four season interest. The sites include the Town Hall and the Medfield Public Library, the stone planters at the entrances to the town serving as a welcome to Medfield, and many island and container gardens within the downtown area. These sites require the year-round efforts of thirty-five Medfield Garden Club volunteers and a budget of $4900. In addition to the twenty-three island and container gardens, the Medfield Garden Club provides the winter wreaths, swags, and greens for the Town House, the Medfield Public Library and the gazebo.
Rationale
For nearly eighty-five years, the club has self-funded its efforts to maintain its civic beautification sites through two major fundraisers: a spring plant sale and a winter holiday greens sale. Unfortunately, over time, these fundraisers have contributed less and less to our revenue due to increased competition with inexpensive nursery or outlet stock, fewer people gardening and more people having landscapers buy and install plants for homeowners and rising prices on the cost of our materials.
The Medfield Garden Club is in need of financial assistance to perform our site renovations and ongoing maintenance. We are requesting that the Town of Medfield partner with us to ensure the continuation of our beautification efforts in the community. The Medfield Garden Club is committed to keeping these twenty-three sites looking their best season to season and year to year. With that goal in mind, the club began making major changes to our TASC sites starting this spring in 2017. Renovations will continue through the summer of 2018.
Schedule and Scope of Work
We are transitioning from annuals, which are expensive, water hungry plants, to native plants, to more drought resistant perennials and to dwarf shrubs. This plan is expensive for start-up costs, but we expect it will pay off over the years with more consistent beauty and hardier plants and with lower maintenance and watering needs. We are utilizing non-toxic water saving crystals in most of the container gardens to further reduce watering needs.
We are also in the process of renovating several sites to neaten and provide continuity among the island gardens with granite curbing and an edging of river stone and mulch. Bobby Kennedy and the DPW crew have been very responsive and helpful as we make some of these hardscaping upgrades. The DPW did a wonderful job building the stone planters at the entrances to Medfield, the DPW site, and at Knollwood and South Streets. The stone planters were installed one at a time over the last several years and are a beautiful welcome into our community.
Additionally, we working with John Thompson to include stone and other artifacts from the Medfield State Hospital to serve as focal points in the island gardens that bookend the Hospital district.
The combination of these efforts will result in more aesthetically pleasing gardens that will be easier and less costly to maintain in terms of worked hours, dollars and water usage.
Summary
Michele Feinsilver, president of the Medfield Garden Club, and I had a recent discussion with Mr. Sullivan who suggested that we request funding from the Local Meals Tax Fund, since most of our sites are within the downtown area and go a long way towards enhancing the appearance of the Town to residents and passersby. To that end, we are requesting $2500 from the Town of Medfield for the renovation and maintenance of our twenty-three sites. All thirty-five of our TASC site volunteers report community members stopping to admire the club’s plantings and to thank us for all we do to beautify the town.
Thank you for your consideration and contribution to our ongoing volunteer efforts.
Nancy Tella
Chairperson, TASC Sites
Medfield Garden Club
Locations of the 2017 Medfield Garden Club TASC Sites
DPW Stone Planter
Harding and West Mill Streets
Hospital Road and Harding Streets
Hospital Road and Route 27
Hospital Road at McCarthy Field
Library Containers
Library In-ground, Native Shade Garden and Walkways
Meeting House Pond
North and Farm Street
North and Harding Streets
North and Pine Streets
North Street and Route 109
Safety Building, Dale Street
Route 109 and Causeway Streets
Route 109 and Hartford Street
Route 109 East Stone Planter
Route 109 West Stone Planter
Route 27 South Stone Planter
Routes 109 and 27
South and Knollwood Streets
South and Philip Streets
South Street Extension and Route 27
Town Hall
Total TASC Four Season Budget 2017
Costs for soil, plant material, annuals and perennials, holiday and seasonal decorations for individual sites and containers
In-ground Sites 12@$150 each $1800
Small Containers 7@$150 each $1050
Large Containers 8@$200 each $1600
Town Hall/Library/Gazebo Winter Greens
Six (6) large wreaths, two (2) regular wreaths, ten (10) swags $ 450
Total TASC Budget for 2017 $4900
Volunteer Hours Necessary to Maintain Sites
The Medfield Garden Club has one TASC coordinator who oversees all sites and site managers. The club has thirty-five site managers who are responsible for planting, weeding and watering on a weekly or twice weekly basis depending on the specific site needs, weather and time of year. Currently, mulch, river stones and curbing is provided by the Town DPW. Water continues to be a pressing issue at most sites and safety is always a concern because the sites are primarily located on highways and byways.
Comments Off on Medfield Garden Club requests town’s financial support
Posted in Financial, Garden Club
For the state budget wonks
This came yesterday too, from former resident and legislature watcher, John Nunnari:

HOUSE, SENATE RUSH OVERDUE $40.2 BILLION BUDGET TO BAKER [+MEDIA]
By Michael P. Norton
STATE HOUSE NEWS SERVICE
STATE HOUSE, BOSTON, JULY 7, 2017…..Largely discarding spending plans they approved in the spring, the House and Senate on Friday sent Gov. Charlie Baker a $40.2 billion state budget that holds state spending flat, includes higher employer health care assessments, and, according to some Democrats, underscores the need for higher taxes and new revenues.
The bill was rushed through the House on a 140-9 vote and then cleared the Senate 36-2. After the votes, Democratic legislative leaders offered differing points of view on their final product.
“In the midst of a tough fiscal climate we’ve delivered a responsible budget that makes targeted investments and protects our most vulnerable citizens,” House Speaker Robert DeLeo said. “I am particularly proud of the work we’ve done on early education and care – which will have a lasting impact on both the workforce and the Commonwealth’s children – and supporting those battling addiction.”
Senate President Stanley Rosenberg took a more dim view of the budget, calling it “the harshest state budget since the last recession.”
“It would have been somewhat better had it contained the Senate’s modest revenue proposals including those on Airbnb, internet hotel resellers, flavored cigars, film tax, and the Community Preservation Act,” he said. “We can take some measure of pride in what we were able to do for local aid, children, and veterans, but too many were left behind.”
Lawmakers put aside many investments they had planned and settled for a budget with a bottom line that roughly mirrors projected state spending for last fiscal year. They did so because tax revenue growth forced them to mark down available revenues by $733 million.
“This budget is not without pain,” Senate Ways and Means Chairwoman Karen Spilka told reporters. “It’s clear that the state is facing a shortfall in revenue that will have an impact on real people’s lives and there are cuts throughout this budget.”
SHNS Video: Sen. Spilka briefing
Asked to identify some of the cuts she described as painful, Spilka said there were reductions in the Executive Office of Human Services and lawmakers were unable to preserve full funding for an account that helps cities and towns pay special education costs.
Spilka said members of a conference committee also pulled aside $104 million for a new reserve fund to cover spending in county sheriff offices and the Committee for Public Counsel Services, the state’s public defender agency. The revenue gap was primarily covered through $502 million in spending reductions, $205 million in “efficiencies and reversions” and the $83 million in revenue from not meeting a trigger to reduce the income tax rate, Spilka said.
House budget chief Rep. Brian Dempsey said the revenue markdown forced $400 million in changes to line items, but said he would hesitate to describe them as cuts because he said in many cases fiscal 2018 spending levels will be higher than levels in the original fiscal 2017 budget.
“These reductions are never easy,” Dempsey said.
SHNS Video: Rep. Dempsey briefing
The Department of Developmental Services will receive a $57 million increase over last year’s budget, but not the $84 million increase the House had initially proposed, Dempsey said.
The budget, Dempsey said, recognizes the problem of “revenue growth slippage” — Spilka called it a “new fiscal reality” — but still invests $40 million in unrestricted local aid, $119 million more in school aid, and $15 million to address the salaries of early education workers.
“I am very pleased that local aid was maintained,” said House Minority Leader Brad Jones, who took issue with the budget development process, which has been marked by a high level of secrecy. Jones also suggested the budget was balanced only by consciously underfunding accounts.
Rep. James Lyons, an Andover Republican, said the budget is predicated on “hopeful” levels of revenue growth, suggesting a 2.9 percent rate of growth is too optimistic since collections over the past year have grown by about 1.4 percent. “These revenue numbers are not going to meet the expectations,” Lyons said.
Another Republican, Rep. Shaunna O’Connell of Taunton, said the rushed vote on the bill that was released Friday morning made it “impossible” for legislators to know for sure what was in the budget and what had been left out.
Senate Democrats shot down a bid by Senate Minority Leader Bruce Tarr to give senators more than a few hours to read the budget before voting on it. Noting an interim budget is in place for the month of July, Tarr said the Senate could afford to postpone the vote until next week.
“It is inappropriate for us at this time to consider a document filed just a few hours ago,” the Gloucester Republican said. “It is more than 320 pages and spends more than $40 billion, which members have had a chance to review for only a very short period of time.”
Sen. William Brownsberger said he viewed Friday’s vote as one of “do I want the state to run or do I not want the state to run.” He noted that the Senate could have waited but that the conference committee report could not be amended regardless.
“We could do it later, but it’s not going to change. The deal’s not going to change,” he said. “I have confidence in the Senate Ways and Means team, I think they did the best they could and it is what it is.”
The budget features new assessments on employers designed to generate $200 million to help the state keep up with the rising costs of MassHealth, the public health insurance program that serves about one million people.
One assessment will boost a per-employee assessment paid by employers from $51 to $77 per year, while another will hit employers with up to $750 per employee if their workers choose MassHealth even though they have access to insurance through their employers.
The new assessments are coupled with plans to reduce the size of a scheduled increase in unemployment insurance rates to $500 million, from $850 million, but House and Senate Democrats discarded MassHealth reforms that Baker recommended in June and which employer groups had hoped would be coupled with the new assessments.
“The proposed state budget fails to honor a compromise reached with the business community that promised reforms alongside any assessment to close MassHealth budget gaps,” Christopher Carlozzi, Massachusetts state director of the National Federation of Independent Businesses, said. “The cost of healthcare is a top issue for Massachusetts small business owners and adding an additional assessment without reining in the cost of a bloated MassHealth program is irresponsible and guarantees the promise of greater budget problems in years to come. The legislature needs to understand that ‘shared responsibility’ is not a one-way street that consistently requires funds from the small business community without addressing the underlying cost drivers.”
Democrats in the Legislature said the budget requires Baker to extract $150 million in savings at MassHealth, but took pride in ruling out eligibility and benefit standard changes. Rep. Christine Barber claimed Baker’s plans would have “undermined” the state’s health care coverage goals.
The compromise budget retains a planned $100 million deposit into the state’s “rainy day” fund, a commitment that Dempsey said could prove important to credit rating agencies who have questioned the strength of the state’s reserves. The deposit would bring the total balance in the fund to $1.4 billion by the end of the fiscal year, but about half of it is contingent on capital gains tax revenues meeting projections.
Dempsey also noted that the House’s marijuana regulation bill, which is still tied up in negotiations, includes $50 million for substance abuse treatment from taxes on retail pot sales, which the House proposed to tax at 28 percent, but the Senate has favored a 12 percent tax.
“It’s a tremendous opportunity, I think, to tax an industry that ought to see a higher tax and use that money really for the betterment of the citizens of the commonwealth and treatment,” he said.
The consensus budget sided with the Senate on a reserve for the implementation of the new marijuana law, appropriating $2 million rather than the House’s approved $4 million.
Jim Borghesani, spokesman for the Yes on 4 Coalition and the Marijuana Policy Project, said the $2 million reserve “falls far short of the funding necessary to build an effective regulatory structure in the time set by the Legislature and the governor.”
“The cost of licensing and tracking software alone, which must be in place before applications can be processed, is estimated at $5.5 million,” Borghesani said. “The Treasurer requested $10 million for the year-one budget. We take elected officials at their word that there will be no more delays, and we hope funding is set at the amount necessary to prevent any more of them.”
The final budget keeps the University of Massachusetts system on track for what UMass President Marty Meehan projected will be a 2 percent to 3 percent hike in student charges this year, including the House’s appropriation of roughly $513 million. Higher education advocates and UMass officials had hoped negotiators would stick with the Senate’s higher figure of $534 million, which was about $4 million shy of the university’s request.
The advocacy group Public Higher Education of Massachusetts said the budget “hurts students and families” by underfunding UMass by $30 million, with state universities and community colleges faring “not much better.”
The budget deal does not include a Senate amendment that municipal officials urged the conference committee to preserve in order to rejuvenate the collapsing partnership between the state and communities that have raised property taxes under the Community Preservation Act.
Lawmakers spared from cuts their planned investments in local aid. “It is absolutely clear that the Legislature looked to protect cities and towns from the state’s revenue challenges,” Geoff Beckwith, executive director of the Mass. Municipal Association, said.
Spilka said budget conferees left out MassHealth reforms recommended by Baker in June dealing with eligibility and benefit changes because they “rejected the notion that we should accept the governor’s health care proposal without the necessary transparency.”
“At a moment when we are rightly horrified by the lack of transparency in the health care debate on the national level, it’s important that we must stick to our principles and ensure such an important proposal for Massachusetts and its residents goes through the proper process,” she said.
According to House officials, the budget is predicated on tax revenues growing 2.9 percent rather than the originally anticipated 3.9 percent, and the budget’s $40.2 billion bottom line is about $1 billion higher than the budget approved at this time last year.
Projected fiscal 2017 spending is estimated at more than $40 billion despite only a 1.4 percent increase in tax revenues last fiscal year, a growth level that prompted Gov. Charlie Baker to hold down agency spending and raid trust funds for nearly $140 million.
Sen. Sonia Chang-Diaz, a Jamaica Plain Democrat who joined Webster Republican Sen. Ryan Fattman in opposing the budget, told the News Service afterward she was “still grappling” with her vote.
“At some point I think you have to be willing to recognize when you are the frog in a boiling pot of water and say, ‘This is not good enough, there are some choices that we could have made without adding a penny to the bottom line that would have done better for the people of Massachusetts,'” she said.
The budget includes “some painful cuts” to elder services programs but does not “appear to materially impair these services overall,” according to Mass. Home Care executive director Al Norman. More than $5.6 million was cut from Executive Office of Elder Affairs line items, according to Norman, who said there should still be sufficient funding to avoid a waiting list for home care services.
Supporters of a proposed surtax on high earners, a proposal marked for a 2018 ballot vote that could generate $2 billion, say low tax revenue growth, rising health care costs and spending demands, and the threat of federal funding cuts are forcing the state to weigh new revenues.
“The projected revenue shortfalls forced the Legislature to abandon some of the modest investments their earlier budgets had sought and led to even greater reliance on temporary measures to balance accounts,” Noah Berger, president of the left-leaning Massachusetts Budget and Policy Center, said in a statement. “Unfortunately, this budget does not even begin to make the kind of major long-term investments that would improve our economy and quality of life by expanding educational opportunity for all of our young people and enhancing our failing infrastructure. Doing that would require fixing flaws in our tax system that allow the highest income residents of the state to pay the smallest share of their income in state and local taxes.”
Given the spending choices lawmakers were forced to make, Dempsey said he and other House leaders might be thinking differently about pursuing additional sources of revenue through taxes or other means if it weren’t likely that voters will decide next year whether to impose a 4 percent surtax on income over $1 million.
“If that were not out there, I think you’d look at it a little bit differently,” Dempsey said.
Newton mayor and Democratic gubernatorial candidate Setti Warren released a statement Friday afternoon expressing concerns with the spending plan.
“By continuing the annual spectacle of using one-time fixes, fiscal sleights of hand and gimmicks to fix the budget, Beacon Hill has decided we are a Commonwealth that will not recognize the truth that state government needs new revenue,” Warren said. “If we don’t fix this broken budget process – if we don’t stand up and demand transparency and admit that we need new revenue – the toll on the Commonwealth will only get worse. The key question facing us is what kind of Commonwealth we want to be. This budget and the way it was developed and passed suggest the Commonwealth we are becoming needs to change.”
Warren also criticized the conference committee’s omission of language directing officials to study the feasibility of building a high-speed rail line between Boston and Springfield. The Senate had unanimously backed the study, an amendment offered by East Longmeadow Democrat Sen. Eric Lesser, saying it train service would allow for a better link between the economies of greater Boston and western Massachusetts. Baker vetoed a similar study from last year’s budget.
[Matt Murphy, Katie Lannan and Colin A. Young contributed reporting.]
END
07/07/2017
Serving the working press since 1894
http://www.statehousenews.com
For assistance with your subscription to the State House News Service, reply to this message or e-mail news@statehousenews.com.
Comments Off on For the state budget wonks
Posted in Budgets, Financial, Legislature, State
MMA says state budget protected municipalities
This alert came yesterday from the Massachusetts Municipal Association with its analysis of the state budget that passed the legislature this week: “Legislators recognize that cities and towns have already passed their fiscal 2018 budgets, which is why they protected the UGGA and Chapter 70 increases that were announced earlier this year and included in the House and Senate budgets.”

| July 7, 2017 | ||||
|
Comments Off on MMA says state budget protected municipalities
Posted in Budgets, Financial, Legislature, Massachusetts Municipal Association, State, Uncategorized
Chip seal
None of prefer the chip seal treatment of our side streets, but given the cost differential, I have come to accept it as a cost effective solution. Please understand that residents are free to opt at the annual town meeting (ATM) to vote to pave streets with asphalt instead of using chip seal. All spending decision ultimately belong to us, the residents, at our ATM. –
Since I recently had a resident question me about the use of chip seal on his street and since I have historically heard the same questions, I asked our DPW Director, Maurice Goulet, if he could quantify the cost savings to share with residents.
=========================================================
Pete,
Below is a comparison of Chip Sealing roadways vs. Pavement Overlay and/or Mill and Overlay as requested.
Consider a scenario of 1 mile of roadway that is 20 feet wide at current contractor prices:
5,280 feet long X 20 feet wide / 9 = 11,733 square yards
$24,639 – chip seal
$69,922 – pavement overlay
(65% savings)
(pavement overlay does not include raising structures such as catch basins, manholes and gates, and reconstructing driveway aprons affected by raising pavement elevation, pavement elevation changes also creates new drainage issues)
Overlaying on a distressed roadway develops reflective cracking through the new surface within a few years affecting longevity of the surface. Milling (grinding) and overlay would then be considered as the preferred method.
$24,639 – chip seal
$91,628 – mill and overlay
(73% savings)
Please let me know if you have any questions. Hope this is helpful.
—
Maurice G. Goulet
Director of Public Works
Medfield, Massachusetts
Department of Public Works
55 North Meadows Road
Medfield, MA 02052
(508) 359-8597 office
(508) 359-4050 fax
Comments Off on Chip seal
Posted in Budgets, DPW, Financial, Town Services
State budget status – expect less aid
This from the Massachusetts Municipal Association on the status of the state budget –

| June 26, 2017 | |||||||||||
|
Comments Off on State budget status – expect less aid
Posted in Budgets, Financial, Legislature, State
