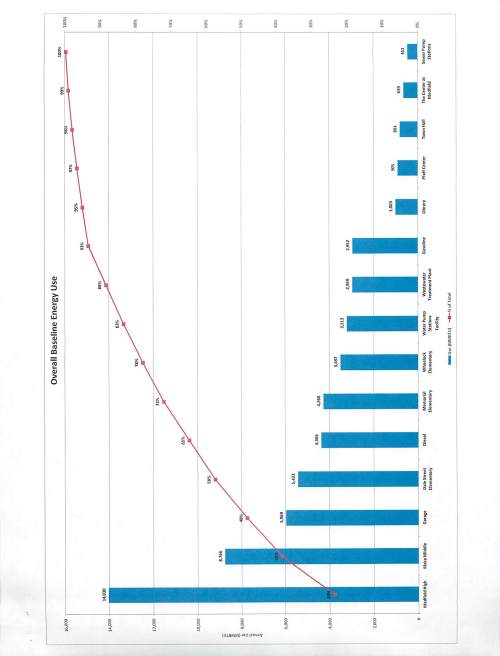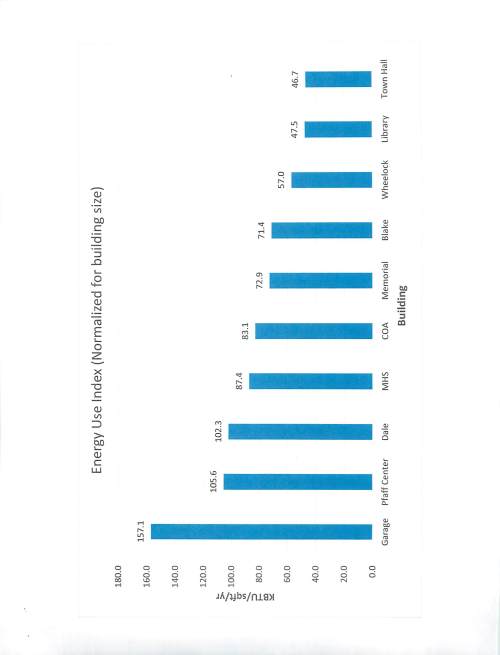
The following data on energy use by the various town buildings was presented to the selectmen Tuesday evening by Andrew Seaman, Facilities Manager. I found the second graph especially interesting, as it presents the energy use per building size. Andrew indicated that there were start up problems at the Garage which hiked up the natural gas usage, and that this past winter I believe he indicated the usage was about half what is noted here. The Pfaff Center is not surprising, given its age. The national average energy usage for schools Andrew as being 59 KBTO/sqft/year, but many of those schools do not have our winters. The Center had high usage for a new building. The Wheelock school is amazing at how energy efficient it is, given that it has single pane windows and has to be fifty years old.
On the first slide I noted the high energy use by water pumps, and Andrew said that is almost entirely well 6 (off Rte. 27 at the Charles River), which is our most productive well and most used well – it takes a lot of energy to move that water up into the water tower.
The third slide was the real reason for Andrew’s presentation, as the town needs to have a plan to reduce our energy usage by 20%, over our base line year, as the last item needed for our qualifying under the Green Communities Act. Andrew was gathering the actual energy use data in order to craft the plan on where that next 20% savings could be found, and that is what he has started to set forth in that third slide.
The Energy Committee made the current 20% reduction task tougher for the town by virtue of the fact that the Energy Committee’s initiatives have already reduced the town energy usage by 30%.
Finally, please know that I did rotate the slides before I saved and uploaded them, but still ended up askew.